
As the Federal Reserve prepares for its September meeting, much attention is focused on the possibility of an interest rate cut. Economic data has been signaling the potential for policy changes, and many investors and economists are trying to forecast what may come next. This blog delves into the historical context of interest rates, examines the present economic landscape, and discusses the implications of the potential rate cuts by the Fed.
Post-World War II to the 1980s: A Rollercoaster of Rates
Historically, interest rates have fluctuated significantly in response to inflationary pressures, economic cycles, and Federal Reserve policy decisions.
- 1950s and 1960s: In the years following World War II, the United States experienced relatively low interest rates, with the federal funds rate averaging between 1-2%. This period was characterized by stable growth and moderate inflation.
- 1970s: Inflation began to rise in the late 1960s, leading to higher interest rates. By the mid-1970s, the federal funds rate had climbed to 5-6% as the Fed tried to manage growing inflationary concerns.
- 1980s: One of the most memorable periods in interest rate history occurred during the early 1980s under Federal Reserve Chairman Paul Volcker. To combat inflation, Volcker dramatically increased the federal funds rate, which peaked at 21.5% in 1981. This sharp rise in rates successfully tamed inflation but also led to a recession.
1990s to 2008: Stability and Gradual Adjustments
The 1990s marked a period of relative calm in terms of interest rate policy. Under the leadership of Alan Greenspan, the Federal Reserve adopted a more measured approach.
- 1990s: Rates typically fluctuated between 3-6% during this decade, with the Fed making gradual adjustments to accommodate economic expansion while keeping inflation in check.
- Early 2000s: After the dot-com bust and the September 11 attacks, the Federal Reserve cut rates significantly, with the federal funds rate hitting a low of 1% in 2003. This was followed by gradual increases in the mid-2000s until the global financial crisis of 2008.
Post-2008 Crisis to Today: Low Rates and Gradual Recovery
The 2008 financial crisis ushered in a new era of historically low interest rates. The Federal Reserve slashed the federal funds rate to near zero (0-0.25%) to stimulate economic activity and prevent further economic collapse. This policy remained in place for several years.
- 2015-2018: As the economy recovered, the Fed began increasing interest rates again, with the rate reaching around 2.25-2.50% by 2018.
- 2020 Pandemic: In response to the economic fallout from the COVID-19 pandemic, the Federal Reserve once again cut rates to near zero, which continued until inflation concerns prompted the Fed to start raising rates in 2022 and 2023.
Current Economic Landscape and Expectations for Rate Cuts
As we approach the September 2024 meeting, the economic indicators are mixed, but many economists and traders anticipate a rate cut. According to a Reuters poll, a majority of economists expect the Fed to reduce rates by 25 basis points during each of its remaining meetings this year, bringing the federal funds rate to a range of 4.50%-4.75% by the end of 2024.
Several factors support this prediction:
- Weaker-than-expected jobs report: A weaker July U.S. jobs report has raised expectations for rate cuts, as the labor market shows signs of cooling.
- Inflation: While inflation is easing, it remains above the Fed’s target of 2%, leading some experts to believe the cuts will be modest rather than aggressive.
- Stable economic growth: Despite concerns, the U.S. economy grew by 2.8% in Q2 of 2024, which indicates resilience even as inflation and rate hikes have slowed some sectors.
Charts to Consider
As we explore the relationship between interest rates and other economic indicators, consider two key charts:
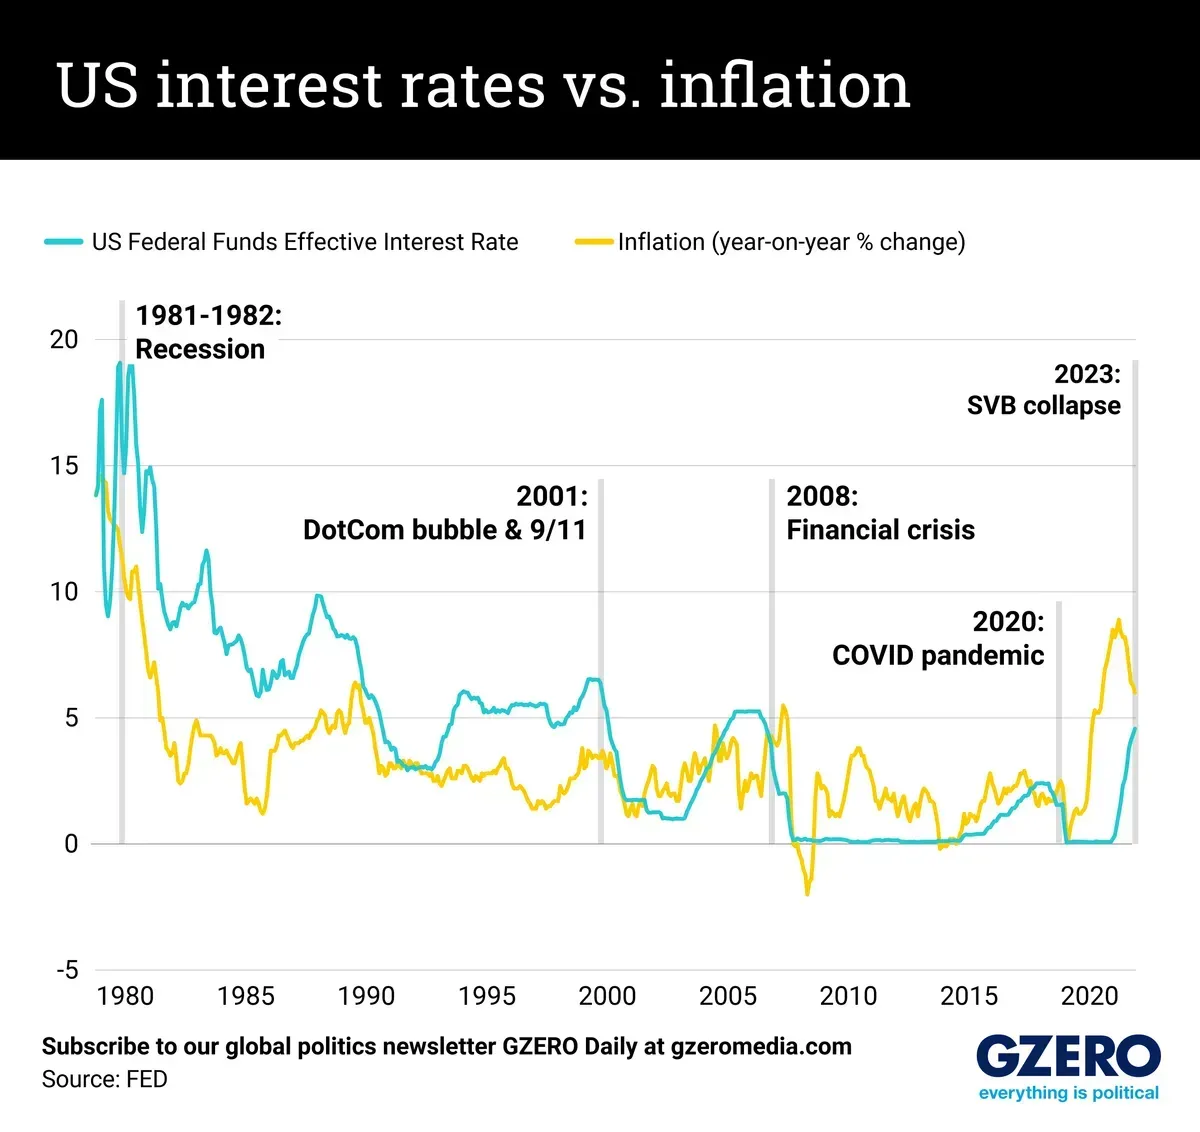
- Interest Rates vs. Inflation: This chart will show how closely the federal funds rate has tracked inflation over the past several decades, highlighting key moments when rate changes were used to combat inflation.
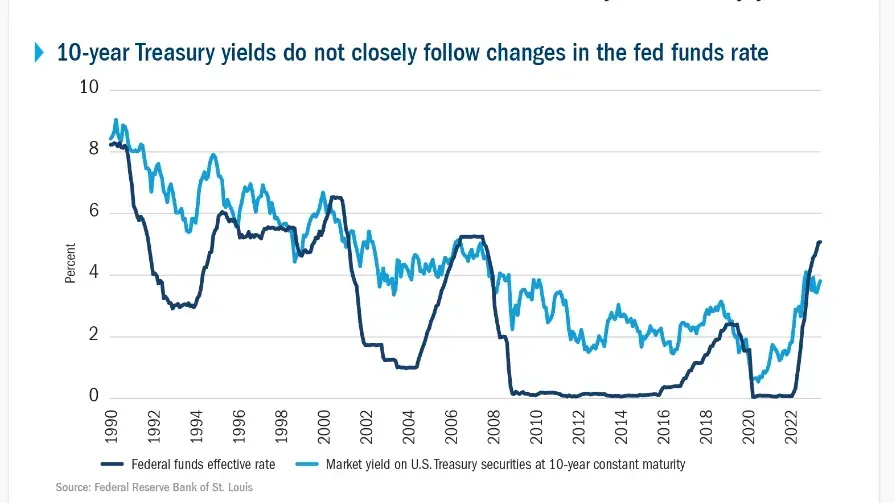
- Interest Rates vs. 10-Year Treasury Yield:
The relationship between the federal funds rate and the 10-year Treasury yield offers insight into investor sentiment and expectations for future economic growth.
What’s Next?
With the September Fed meeting approaching, market participants are watching closely. While there is strong support for modest rate cuts, the overall economic picture remains nuanced. Inflation is slowly receding, and the labor market, while cooling, remains relatively robust. Fed Chair Jerome Powell's upcoming remarks at the Jackson Hole Economic Symposium could provide further clues on the direction of interest rates.
As always, we at Lotus Asset Management are committed to helping you navigate these shifting economic landscapes. For more insights and updates, be sure to follow and like our social media accounts. Stay informed and stay ahead with Lotus Asset Management!